Cartesian Graph
The Cartesian Graph question type allows students to plot and construct geometric objects directly on a coordinate grid. Students interact with a digital graphing interface to place points, draw lines, define segments, rays, construct circles, or sketch shapes based on the task prompt.
This format enables precision-based responses and is particularly effective for assessing algebraic, geometric, and spatial reasoning skills.
Key Characteristics
- Interactive graphing area with an x–y coordinate grid.
- Students can select from a toolset that includes:
- Point, Line, Line Segment, Ray, Circle, and Polygon.
- Student responses are drawn by clicking on coordinate points that define the object (e.g., endpoints, centers, or vertices).
- Tools can be configured based on the task—some questions may only allow certain drawing types.
- Coordinates snap to a grid for accuracy, supporting both exact and visual verification.
Instructional Connection
The Cartesian Graph item is well-suited for tasks that require students to:
- Plot specific points or demonstrate understanding of ordered pairs.
- Draw geometric figures based on given conditions (e.g., a circle with a defined center and radius).
- Model algebraic relationships such as graphing linear equations from two points.
- Verify spatial relationships like slope, symmetry, or distance.
- Visualize and construct mathematical concepts, bridging abstract understanding with concrete graph-based representation.
This format supports higher-order thinking and mathematical modeling, and it is especially powerful in algebra, geometry, coordinate graphing, and data interpretation contexts.
Authoring a Cartesian Graph Question
Access the Question Editor
From the item editor:
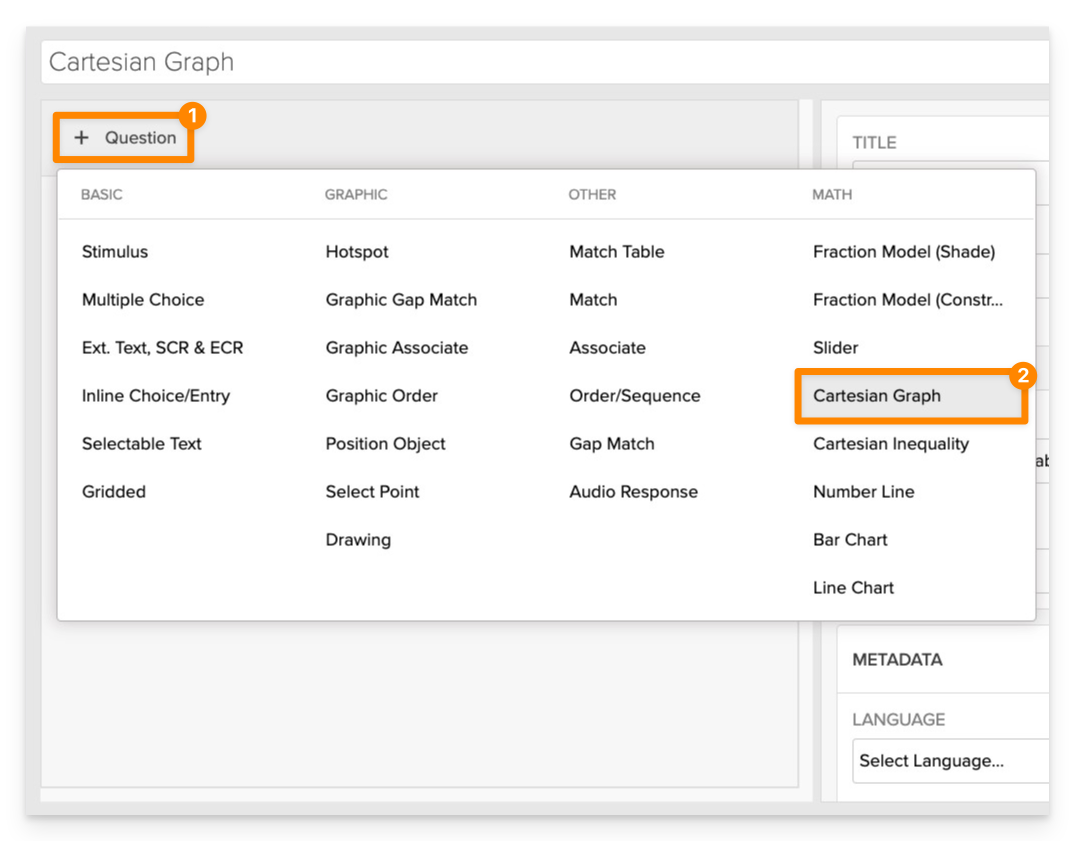
- Click on +Question.
- From the list of question types, select Cartesian Graph.
Enter the Prompt
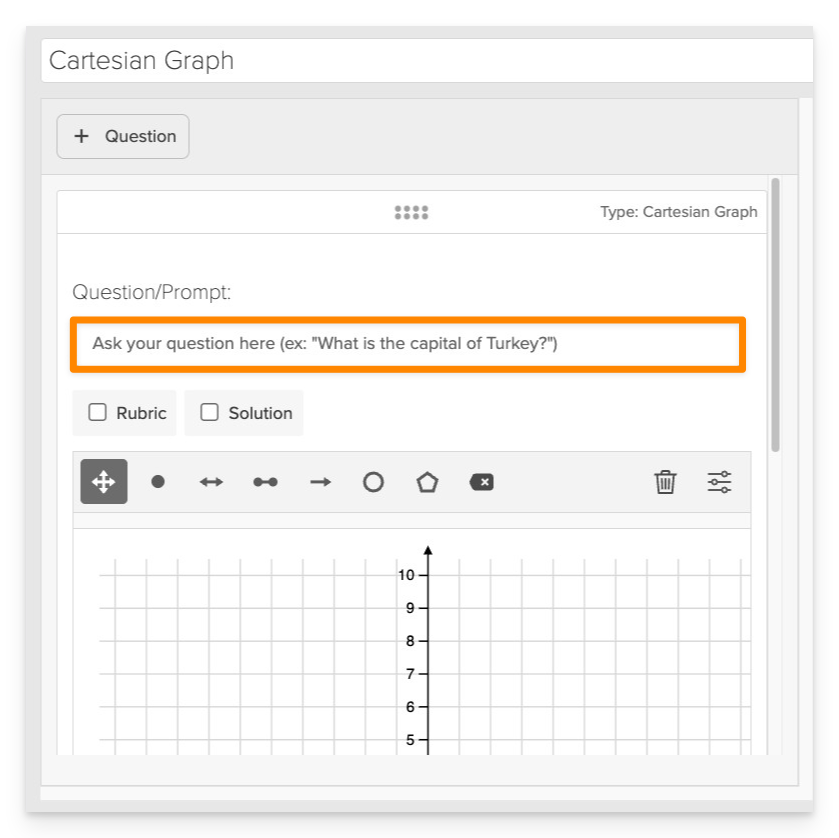
In the Prompt field, provide clear instructions for the student.
- Example: "Plot a point at (3, 2) and draw a line segment from (1, -1) to (4, 3)."
Configure the Graph Settings
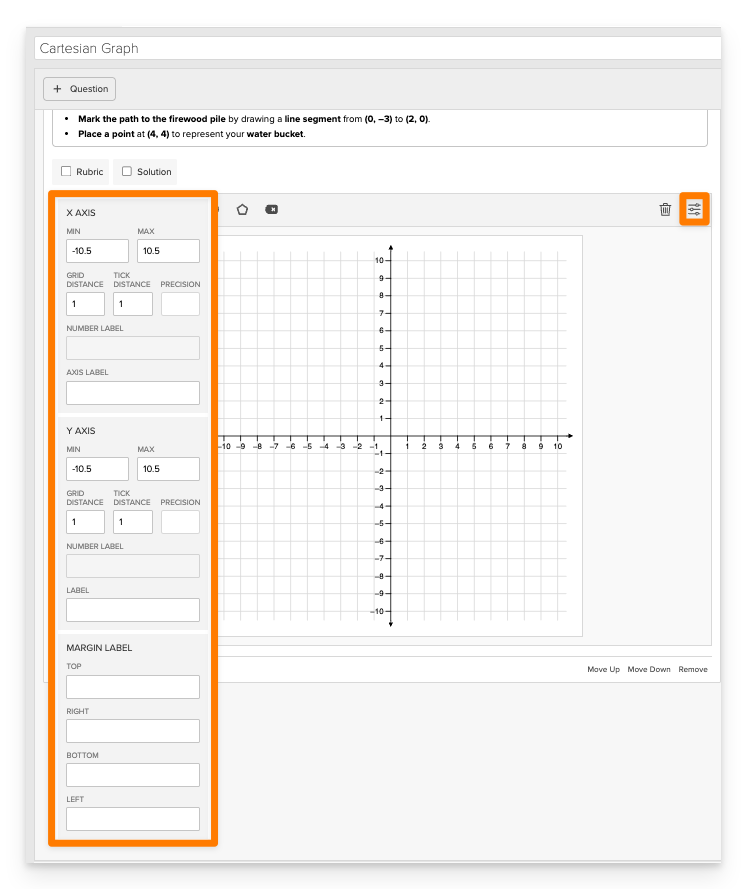
In the Graph Settings panel, define how the coordinate grid will appear and behave. You can adjust both the X Axis and Y Axis independently.
X Axis Settings
- Min: Set the minimum value (e.g.,
-10.5) - Max: Set the maximum value (e.g.,
10.5) - Grid Distance: Controls spacing between grid lines (default:
1) - Tick Distance: Controls spacing between labeled tick marks (default:
1) - Precision: Determines the number of decimal places shown in coordinate labels
- Number Label: set a number label for the axis (e.g.,
π) - Axis Label: Add a custom label for the X Axis (e.g.,
"Distance (ft)")
Y Axis Settings
- Same configurable options as the X Axis:
- Min / Max
- Grid Distance
- Tick Distance
- Precision
- Number Label
- Axis Label
Margin Labels
You can define optional labels to appear outside the graph for additional context or scaffolding:
- Top
- Right
- Bottom
- Left
For most coordinate-based math tasks, a range from -10.5 to 10.5 with a grid and tick distance of 1 works well. Adjust these as needed for larger or smaller graphing spaces.
Define the Correct Answer
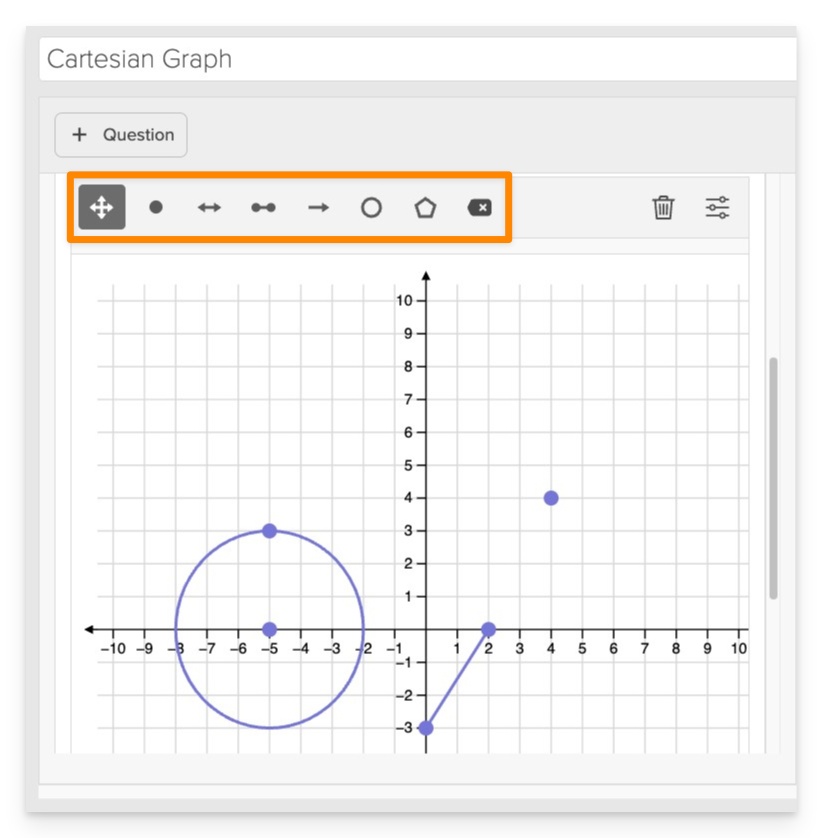
- Use the graphing interface to plot the correct answer:
- Points: Click on the desired coordinates.
- Lines/Segments/Rays: Select the appropriate tool and click on the start and end points.
- Circles: Click on the center point and then a point on the circumference to define the radius.
- Polygons: Click on each vertex in sequence and close the shape by clicking on the starting point.
Always Preview your item. In the preview, click Reveal Key to confirm that all plotted elements—points, lines, circles, or shapes—appear exactly as intended. This is the fastest and most reliable way to check your setup before saving.
Save the Item
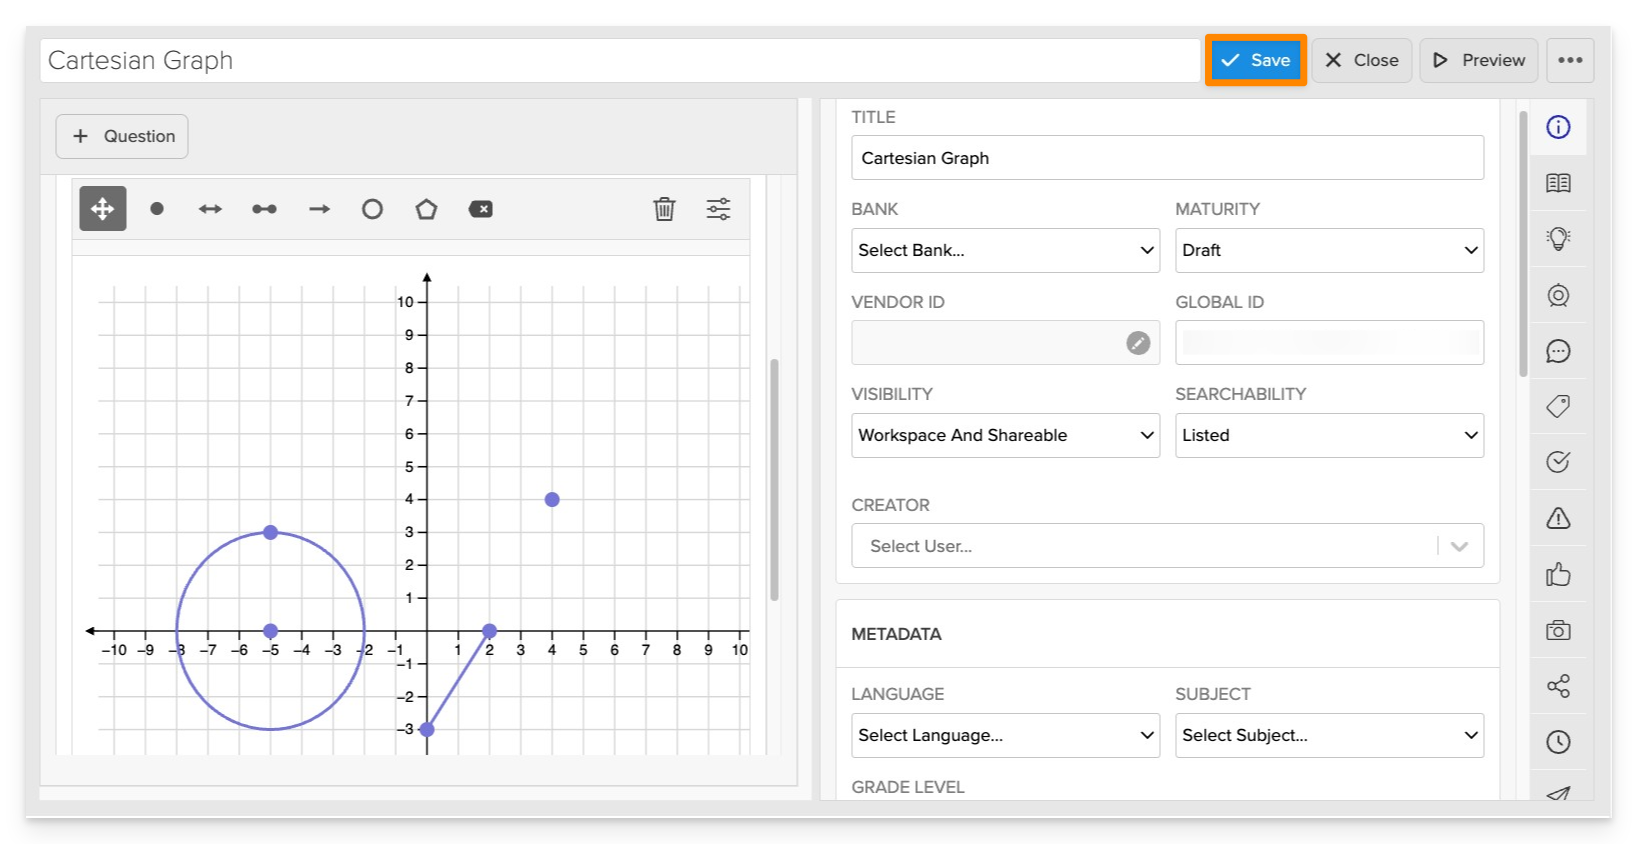
Click Save to store your item in Studio.