Cartesian Inequality
The Cartesian Inequality item type allows students to represent linear inequalities on a coordinate grid by drawing boundary lines and shading solution regions. Students select from solid line or dashed line to indicate whether the boundary is included (≤ or ≥) or excluded (< or >), and then shade the appropriate side of the line to show the solution set.
This item type combines graphing precision with symbolic reasoning, helping students visualize inequality relationships in two variables.
Key Characteristics
- Students use a solid line or dashed line to draw the boundary of the inequality.
- After drawing the line, they shade the correct region of the graph (above, below, left, or right).
- The tool allows for plotting based on:
- Slope-intercept form (e.g., y > 2x + 1)
- Standard form (e.g., 3x – 2y ≤ 6)
- The line style (solid vs. dashed) communicates boundary inclusion or exclusion.
- Grids can be customized to match different instructional needs.
Instructional Connection
Cartesian Inequality questions are ideal for helping students translate algebraic inequalities into visual models. By drawing and shading, students demonstrate conceptual understanding of solution sets, test-point logic, and boundary conditions. This format is especially effective for reinforcing the meaning of inequality symbols and for deepening comprehension of linear systems in Algebra I and II.
Authoring a Cartesian Inequality Question
Access the Question Editor
From the item editor, click on:
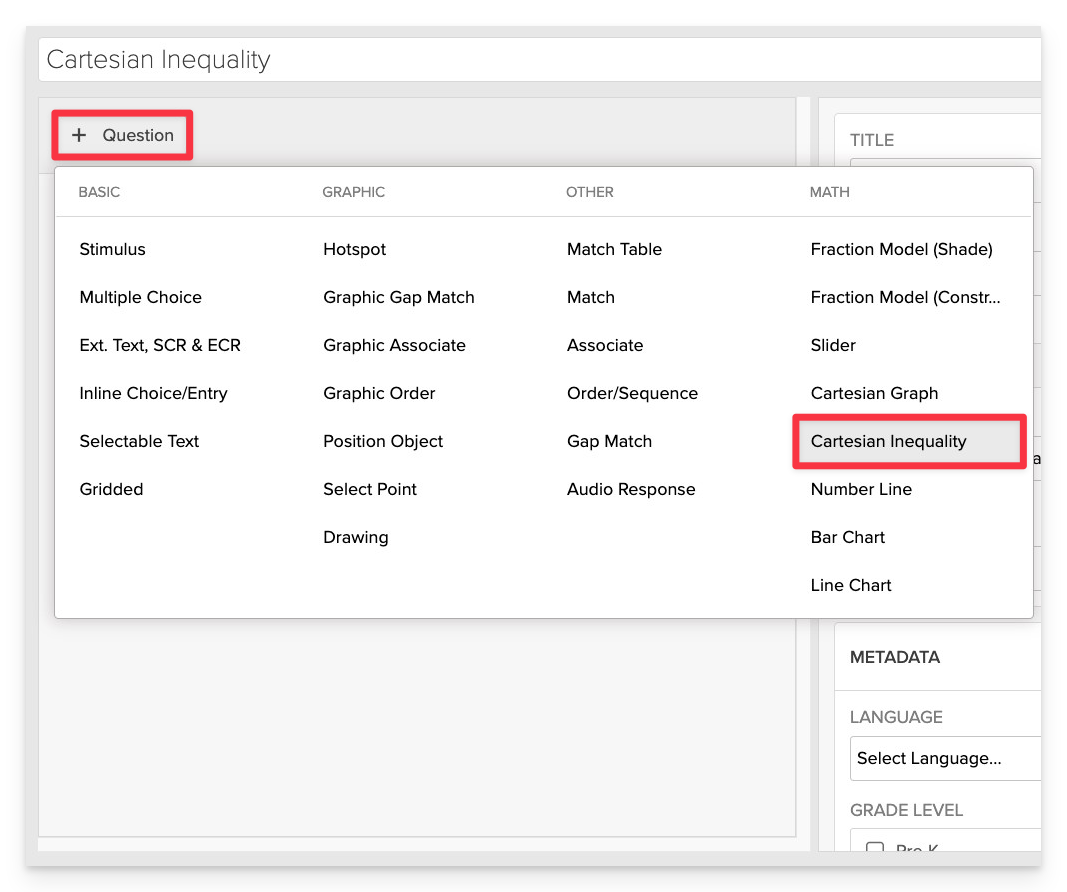
- Click on +Question.
- From the list of question types, select Cartesian Inequality.
Enter the Prompt
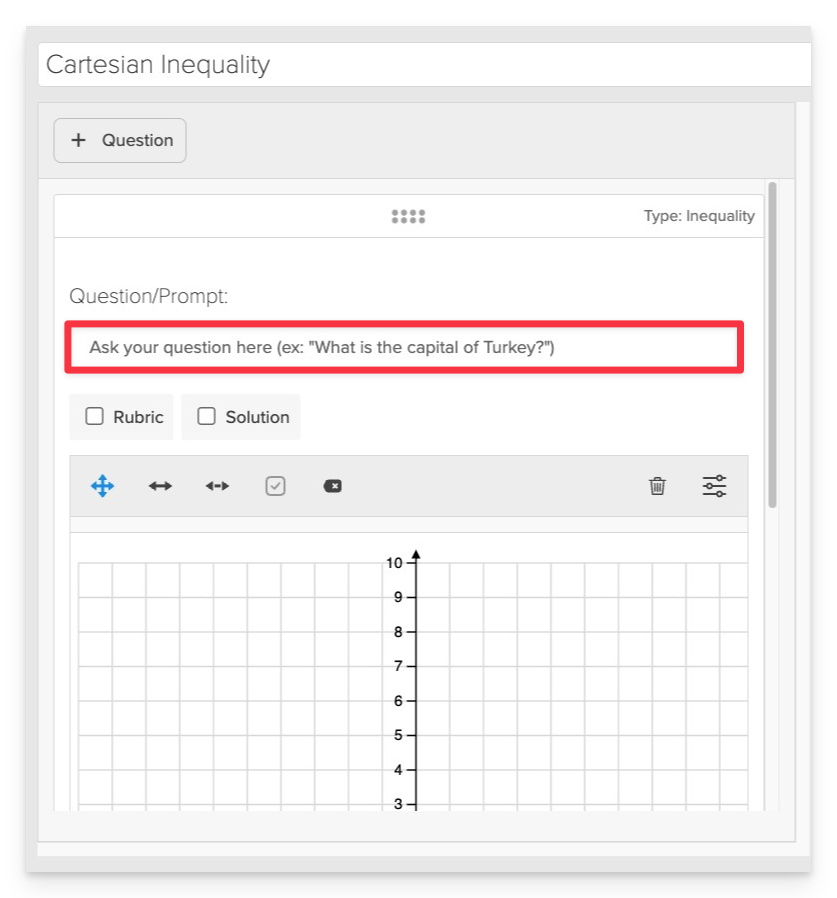
In the Prompt field, provide clear instructions for the student.
- Example: “Graph the inequality y≤−2x+4y. Be sure to use the correct line style and shade the correct region.”
Configure the Graph Settings
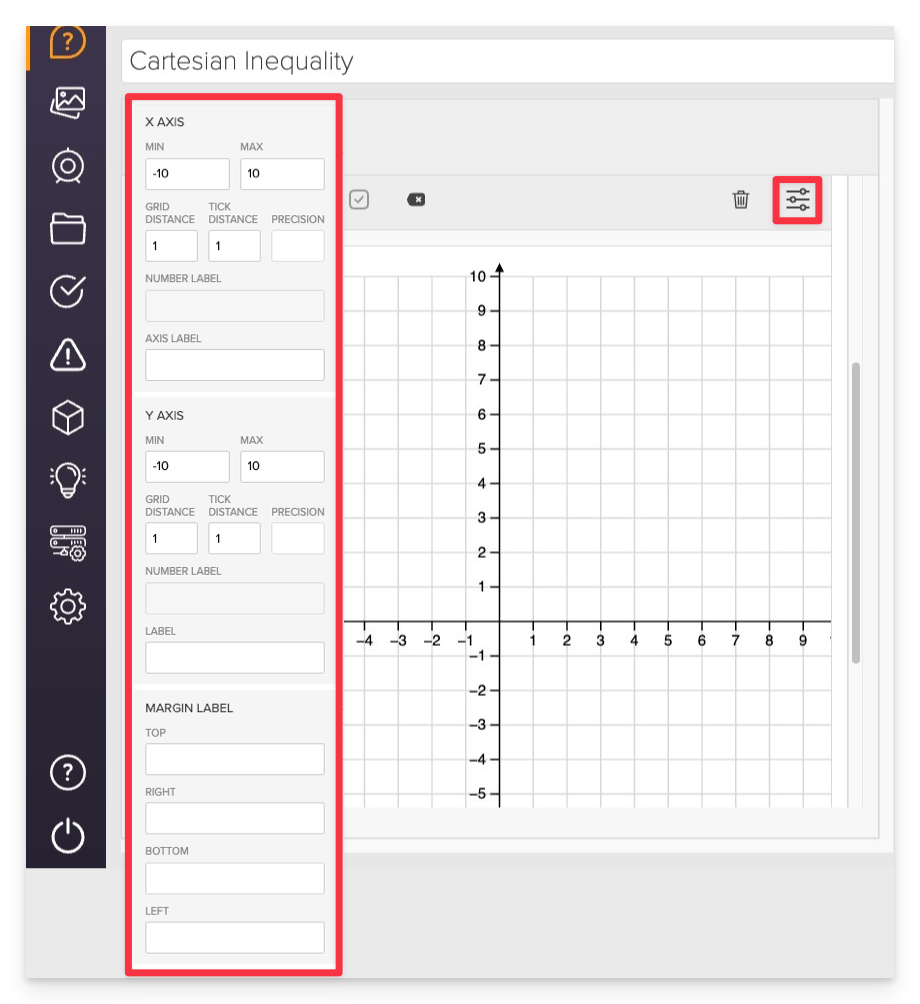
In the Graph Settings panel, define how the coordinate grid will appear and behave. You can adjust both the X Axis and Y Axis independently.
X Axis Settings
- Min: Set the minimum value (e.g.,
10.5) - Max: Set the maximum value (e.g.,
10.5) - Grid Distance: Controls spacing between grid lines (default:
1) - Tick Distance: Controls spacing between labeled tick marks (default:
1) - Precision: Determines the number of decimal places shown in coordinate labels
- Number Label: Toggle number labels on/off for the axis
- Axis Label: Add a custom label for the X Axis (e.g.,
"Distance (ft)")
Y Axis Settings
- Same configurable options as the X Axis:
- Min / Max
- Grid Distance
- Tick Distance
- Precision
- Number Label
- Axis Label
Margin Labels
You can define optional labels to appear outside the graph for additional context or scaffolding:
- Top
- Right
- Bottom
- Left
For most coordinate-based math tasks, a range from -10.5 to 10.5 with a grid and tick distance of 1 works well. Adjust these as needed for larger or smaller graphing spaces.
Define the Correct Answer
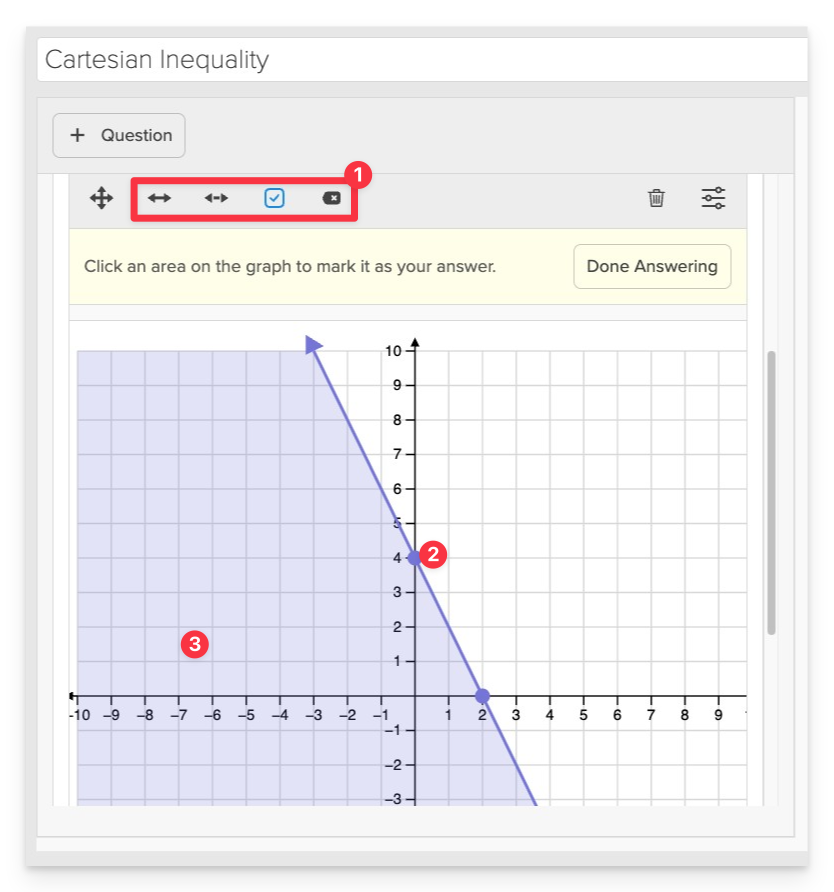
Use the graph interface to:
- Select the appropriate line style (solid or dashed).
- Plot the boundary line using two points.
- Apply shading above or below the line based on the inequality symbol.
Always Preview your item. In the preview, click Reveal Key (or Show Correct Answer, depending on the item type) to confirm that all content—such as correct answers, placement, or visual elements—appears exactly as intended. This is the quickest and most reliable way to check your setup before saving.
Save the Item
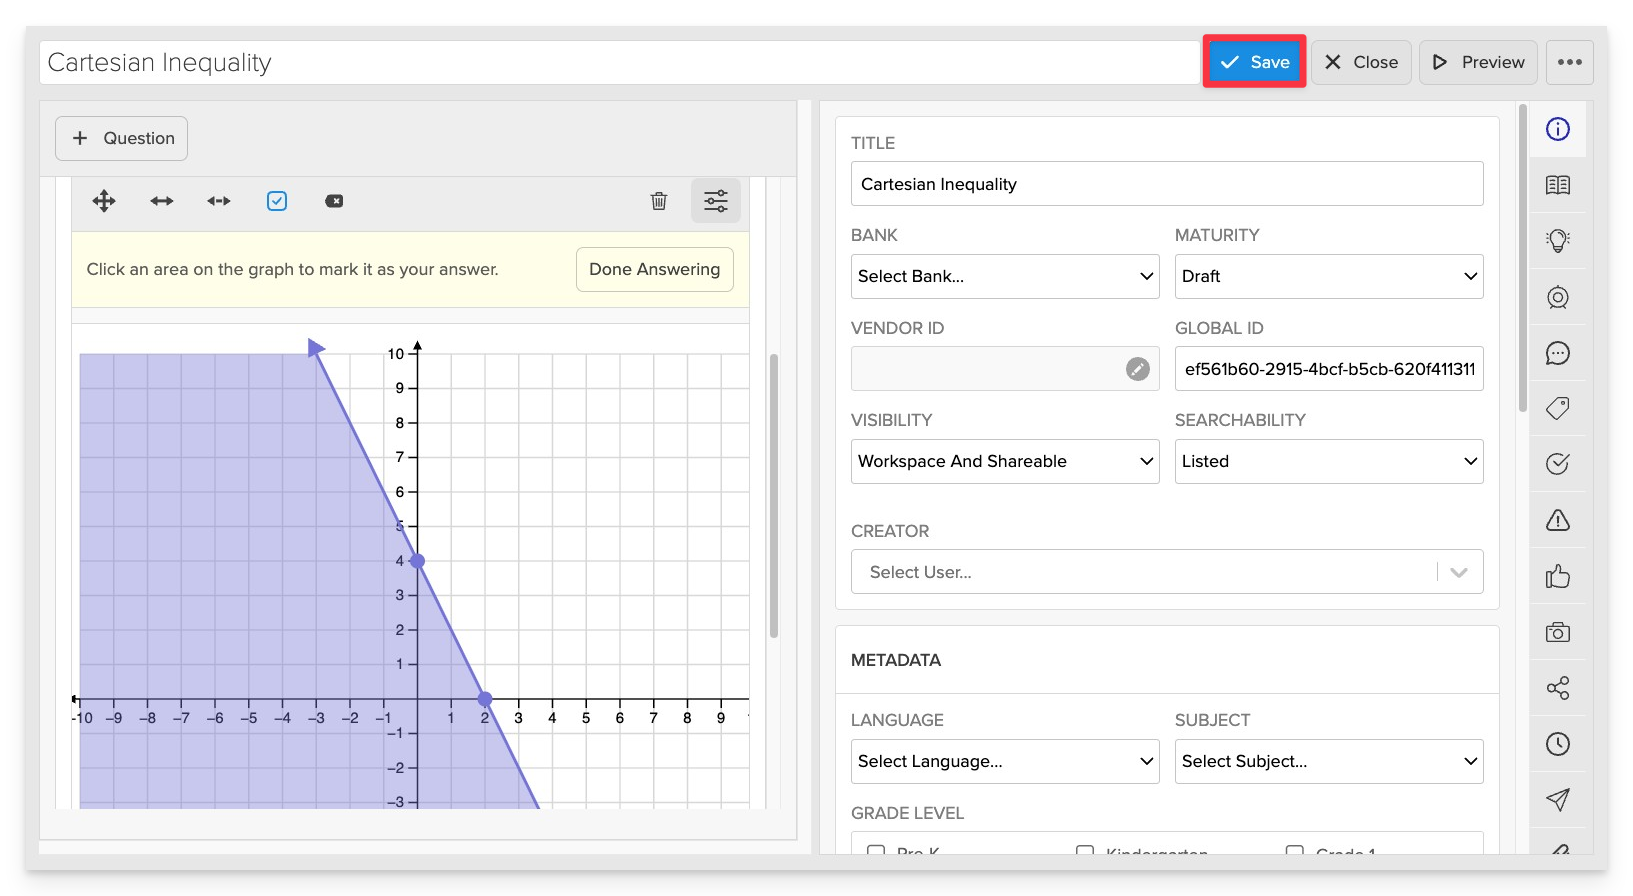
Click Save to store your item in Studio.